
Exploring Spatial Equity in Philadelphia through Public Transit and School Choice

Michael R. Scott
University of Texas, Austin
David T. Marshall
Auburn University
CUSS Newsletter, Summer 2018, Vol 30, No 3
As we prepare for spending a few days in Philadelphia at ASA this year, we wanted to share a bit of our research. David has lived and worked in Philadelphia for a few years, and Mike is from not far away and visits often. That said, it’s made for personally compelling research. Given that we are education researchers, our research specifically is on schools. Therefore, we hope this article gives a preview of Philadelphia through our research on the public schools and the public transportation system.
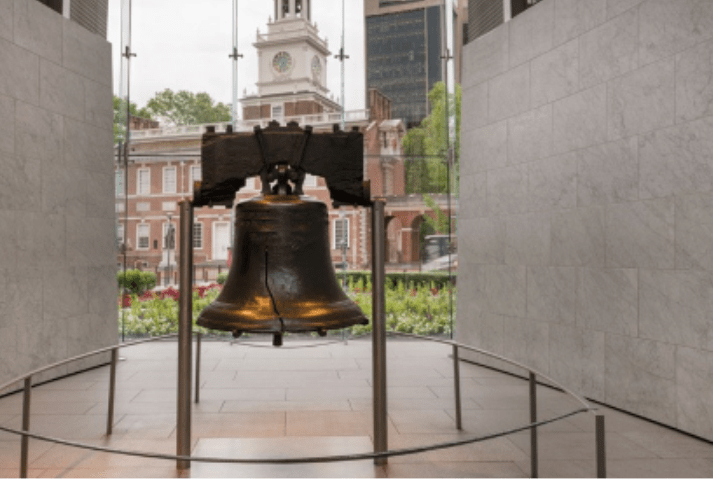
The 2018 ASA Conference will held in Philadelphia.
Before we get into much detail about the city, we’d like to offer the following vignette, a narrative where David reflects on public transportation and what it means for school choice in the city:
“At the end of each day, I would board the eastbound subway train towards my home. Along my journey, I would see groups of students from schools throughout the city board the crowded train as well. For many students, if not a majority of them, the city’s public transportation system is how they got to school. It was how I got to school as their teacher. When it came time for students to decide where to attend high school, many parents of my students would often seek my guidance on how to navigate this system. I would suggest options from which to consider, but the sticking point often was transportation. I recall one specific conversation that I had with a parent of a student who lived in one of the corners of Philadelphia. After each school that I would suggest, his mother would shake her head and say something along the lines of, ‘No, that’s too far. He would have to take a subway, and two buses. It would take almost an hour each way for him to get to and from school.’ This student had outstanding grades and top tier test scores, and he was eligible to attend almost any school in the city he and his family would choose. However, in practical terms, many of the best schools in the city were not feasible options for his family to consider. The eighth largest school district in the country, the Philadelphia public school district educates a diverse group of students from all races and socioeconomic statuses. Their vision states, “For all children, a great school, close to where they live,” which embodies the proliferation of school choice options district-wide. In addition to private schools, many public school options exist for Philadelphia students. These options include traditional neighborhood schools, school district-operated open enrollment schools, school district-operated selective admission schools, public charter schools which are open enrollment, and neighborhood schools operated by a charter, as can be seen in the first map.
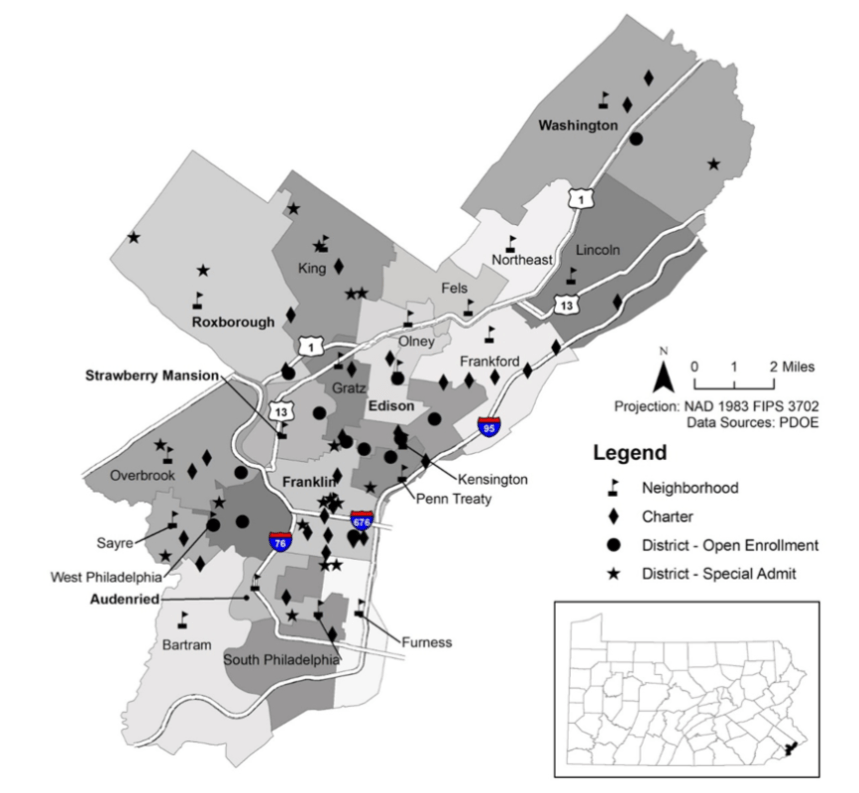
Map 1. All Philadelphia high schools located within zoned high school boundaries.
The city is also committed to ensuring safe transportation for all students to their schools. Specifically, all high school students who do not live on a school bus route or live over a mile and a half from their school are entitled to free public transportation during the weekdays through a program called the Transpass. The city has chosen to use the state transportation funding for this approach for high school students over the traditional yellow buses. Such programs are important particularly for non-white parents who might not engage in school choice due to the lack of vehicle access.1 However, in the Philadelphia context, this is not the case for just non-white families. As David expressed in the vignette, many of his students took the subway. Even he took the subway to work. Another colleague who taught at private preparatory school just outside of the city also anecdotally reported that many of her students took public transportation. In fact, in Philadelphia, the American Community Survey [ACS] 2012-2016 five-year estimates report that 26% of workers who reside in the city take public transportation to work. This proportion increases for those living in poverty: 36% of workers who live below the 100% poverty level commute to work using public transportation. These statistics include those people who do not work within the city. Regardless, this highlights that vehicle access may be less important to attending a school of choice in Philadelphia, but the transportation network is therefore all the more important. The use of the Transpass program is high as well: in 2013, 58,000 of the 134,000 Philadelphia students used SEPTA to get to school.2 It is also important to note that not all students are entitled to a Transpass, so the utility rate of eligible users is much higher.
It’s also important to note that although students may be eligible attend any school within the city, not all schools are of equal quality. For example, while the median four-year graduation rate for zoned, neighborhood high schools in Philadelphia is 64% in 2016, the public school with the lowest graduation rate is 41%. As points of further comparison, the median four-year graduation rate for all public high schools in Philadelphia was 89%, but the overall four-year graduation rate for all students in the city was 74% and 87% for all public school students in the Commonwealth of Pennsylvania. Given the disparities evident between schools, the district has enacted programs to try to close this inequity gap. One strategy, beginning with the 2010-2011 school year, is known at the Renaissance School Initiative.3 The goal of this initiative is to turn around struggling district-run neighborhood schools by transferring the operation of these schools to charter management organizations.
Furthermore, not all schools are open enrollment. Some schools are magnet schools that enroll based on an application-based admissions process using qualitative and/or quantitative metrics. The magnet schools in Philadelphia are all operated by SDP, but also boast the highest graduation rates in the city (median = 96%). As a result of admissions process, not all students will have access to the magnet schools, and therefore may have to travel great distances to arrive at a quality school to which they have access. Given SDP’s vision of a school close to each child’s home, and the need for many students to be close to home to help with familial obligations or other personal reasons, we argue that school district’s implementation of school choice policies must consider the extent of spatial equity for their students.
Commuting to School
When we decided to explore spatial equity, we recognized that commute time must be calculated using the time on public transportation. Although commute time is usually calculated by driving, given our previous discussion, this would inherently miss the true amount of time that it might take to get to school. In our analysis, we calculate the amount of time it would take to get from all of the neighborhood zoned schools to each of the schools of choice in the city. While we recognize that students commute from their homes rather than their zoned school, we decided this would be the best estimate for a community given the lack of individual data. In fact, we find that there is a significant difference between the time it takes (in minutes) to use public transit to get to school (μ=46.86, σ=20.37) and to travel by car (μ=24.82, σ=11.05); t(1721)=70.61, p < 0.001. The 95% confidence interval of the difference in commute time is therefore between 21.75 and 23 minutes. As a result of this analysis, we argue that mode of transportation must be considered. However, that students do not have direct costs associated with using public transportation to school and that most students in Philadelphia use public transportation, this is the most appropriate measure of distance. It is important to note that not all cities guarantee transportation to all schools of choice in their boundaries, which may induce a limiting factor to families. Therefore, analyses of other cities might require including transit cost.
Spatial Equity of Choice Sets
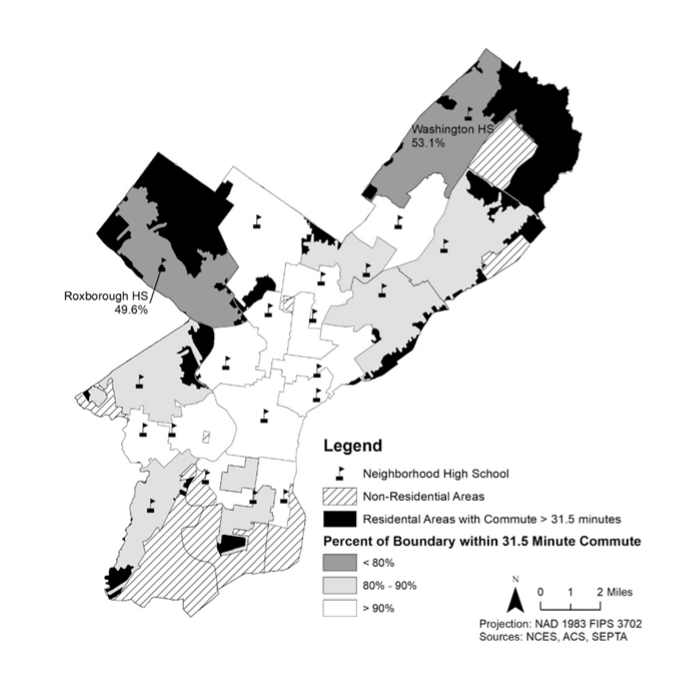
Map 2. Percent of school boundary located within zoned school’s service area.
Although some census tracts are even outside the median amount of time people in Philadelphia commute per the ACS (31.5 minutes), there are other observations worth making here as well. In looking at the second map, we find that two schools where a large percentage of the school boundary is outside of the commute time
area. In the case of the Washington High School, the Northeast Philadelphia airport restricts easy public transportation access. In the case of Roxborough High School in the western part of the city, Wissahickon Valley Park divides the school boundary. However, it is also worth noting that the census tracts outside of the commute time median are low poverty, and anecdotes suggest that many children in these areas attend private schools. The poverty rates of the census tracts in the city are illustrated in the third map.
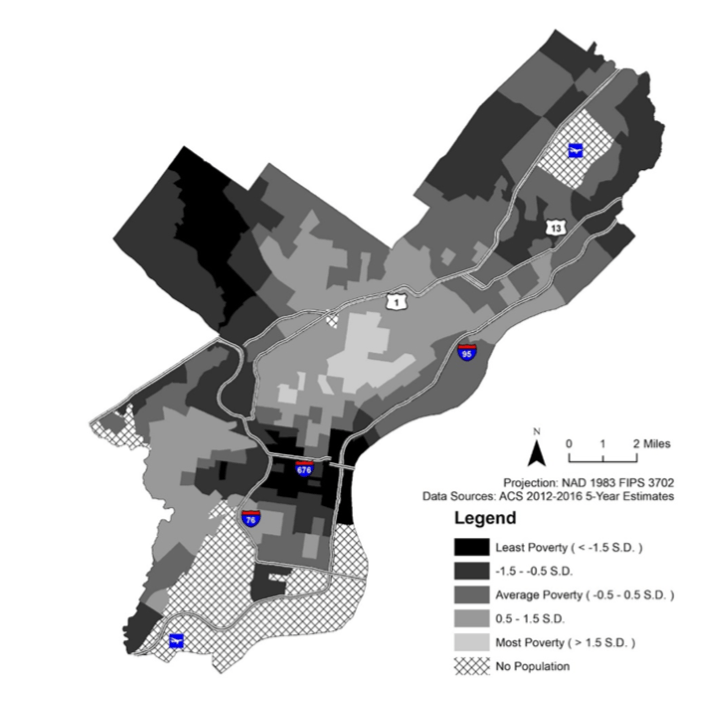
Map 3. Philadelphia poverty levels by census tract.
In order to understand spatial equity based on commute time, we wanted to know which schools a student could attend within the median commute time based on our commute-time variable. Rather than describing all 21 neighborhood schools, we’ll give an example. Consider Universal Audenried Charter High School’s choice set. Audenried lies in South Philadelphia and is one of the city’s three neighborhood Renaissance schools. Students who live in this catchment area have 18 additional options outside of their zoned school at Audenried. See Map 4 for an illustration of this choice set. Four of the 18 options in the Audenried choice set are other neighborhood schools (Bartram, Furness, West Philadelphia, and South Philadelphia). Another six schools are special admission schools, which may not be options for those without the test scores or credentials to gain admittance. Eight open enrollment schools also exist within the choice set that service grades nine through 12, six of which are charter schools. Overall, Audenried’s performance on academic metrics, such as graduation rate and test scores, is better than that of the other four neighborhood schools which lie within the choice set boundaries. However, the SDP and charter school open enrollment schools within the choice set are better than those at Audenried.
Once we described these choice sets, we wanted to know if they were spatially equitable between each other. Therefore, we first fit a series of simple linear regression models, the quality of each choice school is estimated against if the school is within the service area. The quality of school is a score ranging between 0 and 100 determined by SDP using a variety of measures including achievement, progress, climate, and college/career readiness.4 The first analysis included all public schools within the city of Philadelphia, and the independent variable is if the zoned high school is within 31.5 minutes of each choice school. This analysis is to assess the equality of school choice sets. A second analysis is conducted using the same dependent variables, but the independent variable of interest is the level of poverty in the area serving the neighborhood school. This analysis was used to capture the equity of school choice sets, accounting for socioeconomic status of the neighborhoods. Finally, we conduct the same two analyses again assessing only those schools that are open enrollment. That is, if the school requires an application process, it is not necessarily a viable option for all students, and as such we elected to eliminate from our analysis.
To do this, a series of simple linear regression models were fit to explore if there are differences in the groups zoned choice sets, where the null hypothesis of the equality and equity regression models is that catchment area poverty for students who live within 31.5 minutes of the school is not a significant predictor of school quality. For each of the four tests, we fail to reject the null hypothesis, suggesting that spatial equity does exist between the catchment areas. However, even though the catchment areas provide equitable access in terms of school quality when controlling for neighborhood poverty in the Philadelphia context, the average quality of the schools is quite low (27.5 over a possible 100). As a point of comparison, the district’s School Progress Report User Guide indicates that schools receiving a score below 49 should be watched and those that receive a school below 24 require intervention.
Attending the Zoned School
In addition to this descriptive work on examining the spatial equity of the choice sets, we explored what factors might suggest that a student attend the zoned neighborhood school. Given the broad array of schools from which students can choose to attend, and the lower quality scores of the neighborhood schools, we believe it would be important to know who these schools serve. Although we do not have student-level data, SDP provides on their school profiles the number of students attending a school based on catchment zone, as well as the number of students in a catchment zone attending schools of choice. Therefore, we were able to construct a data set calculating the students attending the school that they are zoned to attend. Additionally, we collected data for the schools regarding student demographics, achievement metrics, and neighborhood characteristics. We then estimate a logistic regression model.
For this model, we construct the equivalent of a binary logit model, where the number of students who attend their zoned high school are assigned a value of 1. The number of students who do not attend the high school, calculated by subtracting the number of students attending the school from the total number of high school students living in that catchment are assigned a value of zero. Each observation in the data represents the neighborhood-zoned high school. However, since we are estimating a student-level outcome, a frequency weight is applied for each observation, representing the number of students making the given choice. Given the binary outcome, we estimate the magnitude of the covariates in the prediction of the odds of choosing to attend the neighborhood school. Additionally, the scores in these data are proportions of the school or neighborhood population, so to be able to make comparisons between the odds ratios, each variable is standardized so that the mean is equal to zero and that standard deviation is equal to one.
Our final model is presented in Table 1. Given the moderate to high correlation between student characteristics (such as economically disadvantaged, English learners, and special education students) and race, it would make sense that some of these factors would prove to be non-significant in the final model. Similarly, student outcomes factors including standardized test scores, graduation rates, attendance, and student behavior are also correlated. Given the two assumptions discussed earlier, this model predicts the factors that predict a student either does not engage in choice or actively chooses to attend their zoned school. Although we engaged in a model building process to select the best fitting model, the table only reports the final model, but we will make comments about our general findings below:
Neighborhood Factors
We first include the governmental structure of the school (district-operated or Renaissance model), the amount of neighborhood poverty, and the number of choices the catchment area offers a high school student, using our calculation above. The difference between Renaissance schools and district schools was only significant in the earliest models, suggesting that the school factors are more important than the governance structure itself. Neighborhood poverty is non-significant in the earliest iterations, but the odds ratios decrease in later steps, when race and gender are fit, representing a moderating effect.
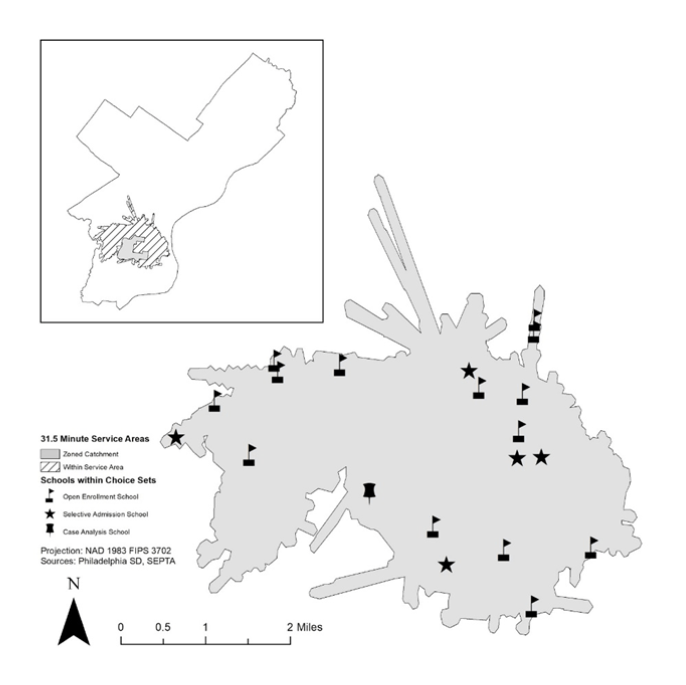
Map 4. School choice options within public transit service areas for Universal Charter School at Audenried.
Student Outcome
Factors
n the second step, student outcome factors including the percent of students passing the standardized tests in literature and Algebra, graduating high school in four years, having good school attendance, and not being suspended from school are included. Given the high correlation among these factors, it makes sense that only one factor predicts attending the zoned school in the final model: passing the standardized tests. In fact, for each standardized unit increase in the student body passing the standardized tests, we can predict that there is a 12% increase in odds to attend the zoned school.
Student Services
Factors
The three student services included in testing the model are free/reduced priced lunch (a proxy variable used to capture school-level economic disadvantage), English learners, and special education students. Percent of special education students are not significant in this model. However, due to the high correlation between special education and student race, this indicates that race predicts attending the zoned school more than special education services. For each standardized unit increase in the student body receiving free/reduced price lunch, we can predict that there is a 29% decrease in odds to attend the zoned school.
Race and Gender
The inclusion of race impacted the model the most, as shown in the reduction of the Bayesian information criterion (BIC). In addition, the previously non-significant effect of neighborhood poverty became significant, and the odds of attending the neighborhood school based on of the percent of English learners increased significantly as well. The suggests the moderating function of a school’s race, which we include in our final model.
Race as a Moderator
In the final stage of the model, we test the moderating effect of race on the neighborhood poverty score. We first interact the two factors before standardizing the score to maintain a consistent scale for interpretation. When including the interaction of poverty and the race variables, the odds ratio (0.409) indicates that one chooses to attend the neighborhood school at a lower rate for each unit increase in neighborhood poverty. However, for each unit increase in neighborhood poverty and each unit increase in Hispanic students attending the school, the odds ratio is 4.605. Similar patterns are also found for English learners. This indicates potential residential racial segregation of Hispanic students in Philadelphia, but further investigation is warranted to make this claim.
Conclusion
The vignette at the beginning of this piece highlights the fact that for even those students who do have the credentials to attend a selective admit school, they may not be able to attend due to transportation constraints. Using GIS and commute times to assess distance from schools are important tools to better understand the school choice landscape. Access to schools when relying on public transportation may be limited by the transit network itself. For example, students in the northeastern sector of the city must travel around an airport. Thus, distance between two schools on either side of the airport should not be measured in geodesic length, because traveling to that school would require travel around the airport, not through it.
This discussion signals limitations that should also be explicitly noted. It is important to note that the descriptions in commute time are related to the zoned high school. Given that we do not have student-level data, we made the decision to focus on the zoned high school as the center of the community. While this does not accurately represent the reality for all students, the approximation still does indicate important trends in understanding spatial equity in school choice in Philadelphia. The second analysis aimed at understanding the school and neighborhood factors that are related to attending the zoned neighborhood school. Findings suggest that there is a racial divide that transcends poverty or linguistic minority status. While we are in Philadelphia for the meeting, the two of us plan to visit many of the different neighborhoods again. Despite our bird’s eye view in this paper, the city’s history and culture is vibrant. We plan on taking the SEPTA to return to visit many of the communities that we have been examining in our research. We hope you have the opportunity to do so as well.
***Please cite as Scott, Michael R. and Marshall, David T. 2018 “Exploring Spatial Equity in Philadelphia through Public Transit and School Choice.” ASA Community & Urban Section (CUSS) Newsletter. William Holt, ed. Summer 2018.
Table 1. Choosing to Attend Zoned School
| Odds Ratio | ||
| % of Catchment in Service Area | 1.357* (0.05) | |
| Catchment Poverty | 0.409* (0.03) | |
| % Pass Standardized Tests | 1.120* (0.05) | |
| % Cohort Graduation | 1.183* (0.04) | |
| % Economically Disadvantaged | 0.710* (0.02) | |
| % English Learner | 3.659* (0.62) | |
| % Black | 0.068* (0.02) | |
| % Hispanic | 0.015* (0.01) | |
| % Asian | 0.152* (0.03) | |
| % Multiracial | 1.106 (0.08) | |
| % Female | 0.847* (0.03) | |
| Hispanic/English Learners Interaction | 1.205 (0.22) | |
| Asian/English Learners Interaction | 10.321* (1.97) | |
| Catchment Poverty/Hispanic Interaction | 4.605* (1.34) | |
| Catchment Poverty/Asian Interaction | 12.959* (2.46) | |
| n | 58864 | |
| Pseudo R2 | 0.069 | |
Notes: All student factors are based on the standardized proportions. Robust standard errors are included in parentheses. * p ≤ .05. Source: Author calculations using data from the School District of Philadelphia.
ENDNOTES
1 Wilson, Elizabeth J., Julian Marshall, Ryan Wilson, and Kevin J. Krizek. 2010. “By Foot, Bus or Car: Children’s School Travel and School Choice Policy.” Environment and Planning A 42(9): 2168-2185.
2 Redfern, Heather. 2013. “SEPTA Offers a Different Type of School Bus.” Transit Dispatches (blog). Metro for Transit and Motorcoach Business. Retrieved July 6, 2018 (http://www.metro-magazine.com/blogpost/240230/septa-offers-a-different-type-of-school-bus).
3 School District of Philadelphia. 2017. Renaissance Initiative. Retrieved July 6, 2018 (https://www.philasd.org/charterschools/portal/renaissance/).
4 School District of Philadelphia. 2017. 2016-2017 School Progress Report User Guide. Retrieved July 6, 2018 (https://cdn.philasd.org/offices/performance/SPR_Files/2016-2017/SPR_SY1617_User_Guide_20180305.pdf).
